E Data Frame Wrangling in R
These lecture notes are distributed in the hope that they will be useful. Any bug reports are appreciated.
R data.frames are similar to matrices in the sense that
we use them to store tabular data.
However, in data frames each column can be of different type:
head(iris)## Sepal.Length Sepal.Width Petal.Length Petal.Width Species
## 1 5.1 3.5 1.4 0.2 setosa
## 2 4.9 3.0 1.4 0.2 setosa
## 3 4.7 3.2 1.3 0.2 setosa
## 4 4.6 3.1 1.5 0.2 setosa
## 5 5.0 3.6 1.4 0.2 setosa
## 6 5.4 3.9 1.7 0.4 setosahead(rpart::car90, 2)## Country Disp Disp2 Eng.Rev Front.Hd Frt.Leg.Room Frt.Shld
## Acura Integra Japan 112 1.8 2935 3.5 41.5 53.0
## Acura Legend Japan 163 2.7 2505 2.0 41.5 55.5
## Gear.Ratio Gear2 HP HP.revs Height Length Luggage
## Acura Integra 3.26 3.21 130 6000 47.5 177 16
## Acura Legend 2.95 3.02 160 5900 50.0 191 14
## Mileage Model2 Price Rear.Hd Rear.Seating RearShld
## Acura Integra NA 11950 1.5 26.5 52.0
## Acura Legend 20 24760 2.0 28.5 55.5
## Reliability Rim Sratio.m Sratio.p Steering Tank Tires
## Acura Integra Much better R14 NA 0.86 power 13.2 195/60
## Acura Legend Much better R15 NA 0.96 power 18.0 205/60
## Trans1 Trans2 Turning Type Weight Wheel.base Width
## Acura Integra man.5 auto.4 37 Small 2700 102 67
## Acura Legend man.5 auto.4 42 Medium 3265 109 69E.1 Creating Data Frames
Most frequently, we will be creating data frames based on a series of numeric, logical, characters vectors of identical lengths.
x <- data.frame(
    u=runif(5),
    v=sample(c(TRUE, FALSE), 5, replace=TRUE),
    w=LETTERS[1:5]
)
print(x)
## u v w
## 1 0.181517 TRUE A
## 2 0.919723 FALSE B
## 3 0.311723 FALSE C
## 4 0.064152 TRUE D
## 5 0.396422 FALSE ESome objects, such as matrices, can easily be coerced to data frames:
(A <- matrix(1:12, byrow=TRUE, nrow=3,
    dimnames=list(
        NULL,     # row labels
        c("x", "y", "z", "w") # column labels
)))
## x y z w
## [1,] 1 2 3 4
## [2,] 5 6 7 8
## [3,] 9 10 11 12as.data.frame(A)## x y z w
## 1 1 2 3 4
## 2 5 6 7 8
## 3 9 10 11 12Named lists are amongst other candidates for a meaningful conversion:
(l <- lapply(split(iris$Sepal.Length, iris$Species),
    function(x) {
        c(min=min(x), median=median(x), mean=mean(x), max=max(x))
    }))
## $setosa
## min median mean max
## 4.300 5.000 5.006 5.800
##
## $versicolor
## min median mean max
## 4.900 5.900 5.936 7.000
##
## $virginica
## min median mean max
## 4.900 6.500 6.588 7.900as.data.frame(l)## setosa versicolor virginica
## min 4.300 4.900 4.900
## median 5.000 5.900 6.500
## mean 5.006 5.936 6.588
## max 5.800 7.000 7.900E.2 Importing Data Frames
Many interesting data frames come from external sources, such as CSV files, web APIs, SQL databases and so on.
In particular, read.csv() (see ?read.table for a long list
of tunable parameters) imports data from plain text files
organised in a tabular manner (such as comma-separated lists of values):
f <- tempfile() # temporary file name
write.csv(x, f, row.names=FALSE) # save data frame to file
cat(readLines(f), sep="\n") # print file contents
## "u","v","w"
## 0.181517061544582,TRUE,"A"
## 0.919722604798153,FALSE,"B"
## 0.31172346835956,FALSE,"C"
## 0.0641516039613634,TRUE,"D"
## 0.396421572659165,FALSE,"E"read.csv(f)## u v w
## 1 0.181517 TRUE A
## 2 0.919723 FALSE B
## 3 0.311723 FALSE C
## 4 0.064152 TRUE D
## 5 0.396422 FALSE ENote that CSV is by far the most portable format for exchanging matrix-like objects between different programs (statistical or numeric computing environments, spreadsheets etc.).
E.3 Data Frame Subsetting
E.3.1 Each Data Frame is a List
First of all, we should note that each data frame is in fact represented as an ordinary named list:
class(x)## [1] "data.frame"typeof(x)## [1] "list"Each column is stored as a separate list item. Having said that, we shouldn’t be surprised that we already know how to perform quite a few operations on data frames:
length(x) # number of columns## [1] 3names(x) # column labels## [1] "u" "v" "w"x$u # accessing column `u` (synonym: x[["u"]])## [1] 0.181517 0.919723 0.311723 0.064152 0.396422x[[2]] # 2nd column## [1] TRUE FALSE FALSE TRUE FALSEx[c(1,3)] # a sub-data.frame## u w
## 1 0.181517 A
## 2 0.919723 B
## 3 0.311723 C
## 4 0.064152 D
## 5 0.396422 Esapply(x, class) # apply class() on each column## u v w
## "numeric" "logical" "character"E.3.2 Each Data Frame is Matrix-like
Data frames can be considered as “generalised” matrices. Therefore, operations such as subsetting will work in the same manner.
dim(x) # number of rows and columns## [1] 5 3x[1:2,] # first two rows## u v w
## 1 0.18152 TRUE A
## 2 0.91972 FALSE Bx[,c(1,3)] # 1st and 3rd column, synonym: x[c(1,3)]## u w
## 1 0.181517 A
## 2 0.919723 B
## 3 0.311723 C
## 4 0.064152 D
## 5 0.396422 Ex[,1] # synonym: x[[1]]## [1] 0.181517 0.919723 0.311723 0.064152 0.396422x[,1,drop=FALSE] # synonym: x[1]## u
## 1 0.181517
## 2 0.919723
## 3 0.311723
## 4 0.064152
## 5 0.396422Take a special note of selecting rows based on logical vectors.
For instance, let’s extract all the rows from x where the values
in the column named u are between 0.3 and 0.6:
x[x$u>=0.3 & x$u<=0.6, ]## u v w
## 3 0.31172 FALSE C
## 5 0.39642 FALSE Ex[!(x[,"u"]<0.3 | x[,"u"]>0.6), ] # equivalent## u v w
## 3 0.31172 FALSE C
## 5 0.39642 FALSE EMoreover, subsetting based on integer vectors can be used to
change the order of rows. Here is how we can sort the rows in x
with respect to the values in column u:
(x_sorted <- x[order(x$u),])## u v w
## 4 0.064152 TRUE D
## 1 0.181517 TRUE A
## 3 0.311723 FALSE C
## 5 0.396422 FALSE E
## 2 0.919723 FALSE BLet’s stress that the programming style we emphasise on here is very
transparent. If we don’t understand how a complex operation is being executed,
we can always decompose it into smaller chunks that can be studied separately.
For instance, as far as the last example is concerned, we can
take a look at the manual of ?order and then inspect the result
of calling order(x$u).
On a side note, we can re-set the row names by referring to:
row.names(x_sorted) <- NULL
x_sorted
## u v w
## 1 0.064152 TRUE D
## 2 0.181517 TRUE A
## 3 0.311723 FALSE C
## 4 0.396422 FALSE E
## 5 0.919723 FALSE BE.4 Common Operations
We already know how to filter rows based on logical conditions, e.g.:
iris[iris$Petal.Width >= 1.2 & iris$Petal.Width <= 1.3,
    c("Petal.Width", "Species")]
## Petal.Width Species
## 54 1.3 versicolor
## 56 1.3 versicolor
## 59 1.3 versicolor
## 65 1.3 versicolor
## 72 1.3 versicolor
## 74 1.2 versicolor
## 75 1.3 versicolor
## 83 1.2 versicolor
## 88 1.3 versicolor
## 89 1.3 versicolor
## 90 1.3 versicolor
## 91 1.2 versicolor
## 93 1.2 versicolor
## 95 1.3 versicolor
## 96 1.2 versicolor
## 97 1.3 versicolor
## 98 1.3 versicolor
## 100 1.3 versicoloriris[iris$Sepal.Length > 6.5 & iris$Species == "versicolor", ]## Sepal.Length Sepal.Width Petal.Length Petal.Width Species
## 51 7.0 3.2 4.7 1.4 versicolor
## 53 6.9 3.1 4.9 1.5 versicolor
## 59 6.6 2.9 4.6 1.3 versicolor
## 66 6.7 3.1 4.4 1.4 versicolor
## 76 6.6 3.0 4.4 1.4 versicolor
## 77 6.8 2.8 4.8 1.4 versicolor
## 78 6.7 3.0 5.0 1.7 versicolor
## 87 6.7 3.1 4.7 1.5 versicolorand aggregate information in individual columns:
sapply(iris[1:4], summary)## Sepal.Length Sepal.Width Petal.Length Petal.Width
## Min. 4.3000 2.0000 1.000 0.1000
## 1st Qu. 5.1000 2.8000 1.600 0.3000
## Median 5.8000 3.0000 4.350 1.3000
## Mean 5.8433 3.0573 3.758 1.1993
## 3rd Qu. 6.4000 3.3000 5.100 1.8000
## Max. 7.9000 4.4000 6.900 2.5000Quite frequently, we will be interested in summarising data within subgroups generated by a list of factor-like variables.
aggregate(iris[1:4], iris[5], mean) # not: iris[, 5] !## Species Sepal.Length Sepal.Width Petal.Length Petal.Width
## 1 setosa 5.006 3.428 1.462 0.246
## 2 versicolor 5.936 2.770 4.260 1.326
## 3 virginica 6.588 2.974 5.552 2.026ToothGrowth[sample(nrow(ToothGrowth), 5), ] # 5 random rows## len supp dose
## 12 16.5 VC 1.0
## 10 7.0 VC 0.5
## 17 13.6 VC 1.0
## 50 27.3 OJ 1.0
## 60 23.0 OJ 2.0aggregate(ToothGrowth["len"], ToothGrowth[c("supp", "dose")], median)## supp dose len
## 1 OJ 0.5 12.25
## 2 VC 0.5 7.15
## 3 OJ 1.0 23.45
## 4 VC 1.0 16.50
## 5 OJ 2.0 25.95
## 6 VC 2.0 25.95According to the manual of the aggregate function,
see help("aggregate"), the syntax is aggregate(x, by, FUN), where:
xis a data frame whose columns are to be aggregated;byis a list of grouping elements, each as long as the variables in the data framex; recall that each data frame is a list of vectors of identical lengths, so ultimately this can also be a data frame as well; this is why we have writteniris[5]and neitheriris[[5]]noriris[, 5](although we could have used theiris[, 5, drop=FALSE]notation);FUNis an R function to be applied on each column inxwithin all groups of observations defined byby.
Further arguments can be passed to the function being called,
e.g., using the notation like aggregate(X, y, mean, na.rm=TRUE).
Below are examples using the built-in ToothGrowth data frame.
As an exercise, run all the following lines in R and study
the results carefully:
ToothGrowth["supp"]  # selects a specific column from a data frame; the result is still a data frame; remember that a data frame is also a list
ToothGrowth[["supp"]] # this is different - this is a vector; cannot be used in aggregate, at least not as `by` argument; extracts data from a column, is no longer a data frame
ToothGrowth[c("supp", "dose")]  # selects 2 columns
aggregate(ToothGrowth["len"], ToothGrowth["supp"], mean)  # computing average len in groups defined by supp
aggregate(ToothGrowth["len"], ToothGrowth[c("supp", "dose")], mean)  # computing average len in groups defined by combinations of supp and dose
f <- function(x) c(MEAN=mean(x), MEDIAN=median(x))  # a custom function that returns two aggregates in form of a named (labelled) vector
aggregate(ToothGrowth["len"], ToothGrowth["supp"], f)
aggregate(ToothGrowth["len"], ToothGrowth[c("supp", "dose")], f)We can introduce new grouping variables of any kind, for example based on data in other columns. Run the following line by line:
ToothGrowth[["dose_1_or_2"]] <- ToothGrowth[["dose"]] >= 1.0  # note 2 square brackets now - dealing with individual columns
ToothGrowth  # note the added column
aggregate(ToothGrowth["len"], ToothGrowth["dose_1_or_2"], function(x) c(MIN=min(x), MAX=max(x)))
Taking into account that split() accepts a data frame input as well,
we can perform what follows:
sapply(
    # split iris into 3 sub-data.frames:
    split(iris, iris[5]),
    # on each sub-data.frame, apply the following function
    function(df) {
        # compute the mean of first four columns:
        sapply(df[1:4], mean)
    })
## setosa versicolor virginica
## Sepal.Length 5.006 5.936 6.588
## Sepal.Width 3.428 2.770 2.974
## Petal.Length 1.462 4.260 5.552
## Petal.Width 0.246 1.326 2.026sapply(split(iris, iris[5]), function(df) {
c(Sepal.Length=summary(iris$Sepal.Length),
Petal.Length=summary(iris$Petal.Length)
)
})## setosa versicolor virginica
## Sepal.Length.Min. 4.3000 4.3000 4.3000
## Sepal.Length.1st Qu. 5.1000 5.1000 5.1000
## Sepal.Length.Median 5.8000 5.8000 5.8000
## Sepal.Length.Mean 5.8433 5.8433 5.8433
## Sepal.Length.3rd Qu. 6.4000 6.4000 6.4000
## Sepal.Length.Max. 7.9000 7.9000 7.9000
## Petal.Length.Min. 1.0000 1.0000 1.0000
## Petal.Length.1st Qu. 1.6000 1.6000 1.6000
## Petal.Length.Median 4.3500 4.3500 4.3500
## Petal.Length.Mean 3.7580 3.7580 3.7580
## Petal.Length.3rd Qu. 5.1000 5.1000 5.1000
## Petal.Length.Max. 6.9000 6.9000 6.9000The above syntax solely relies on the building blocks that we have already mastered! This should be very appealing to the minimalists.
Note that R packages data.table and dplyr provide us with
reimplementations of the most important functions for the processing
of data frames. We only cover the classic/base functions here,
because they have existed since the very beginning of R. These are known
to every R user and are likely to work this way forever.
Having said this, we should acknowledge that some users might find
dplyr or data.table more convenient
(oftentimes they are faster or handle big data better) in many contexts.
The problem, though, is that when faced with less typical problems
(as a future AI/ML engineer/data scientist we’ll be particularly
exposed to them), we’ll have to fall back to base R anyway,
because it is more powerful and gives us more transferable skills
(also with regards to objects of different types, e.g., matrices).
This is exactly why we prefer functions like aggregate()
subsetting like df[,], etc.
E.5 Metaprogramming and Formulas (*)
R (together with a few other programming languages such as Lisp and Scheme, that heavily inspired R’s semantics) allows its programmers to apply some metaprogramming techniques, that is, to write programs that manipulate unevaluated R expressions.
For instance, take a close look at the following plot:
z <- seq(-2*pi, 2*pi, length.out=101)
plot(z, sin(z), type="l")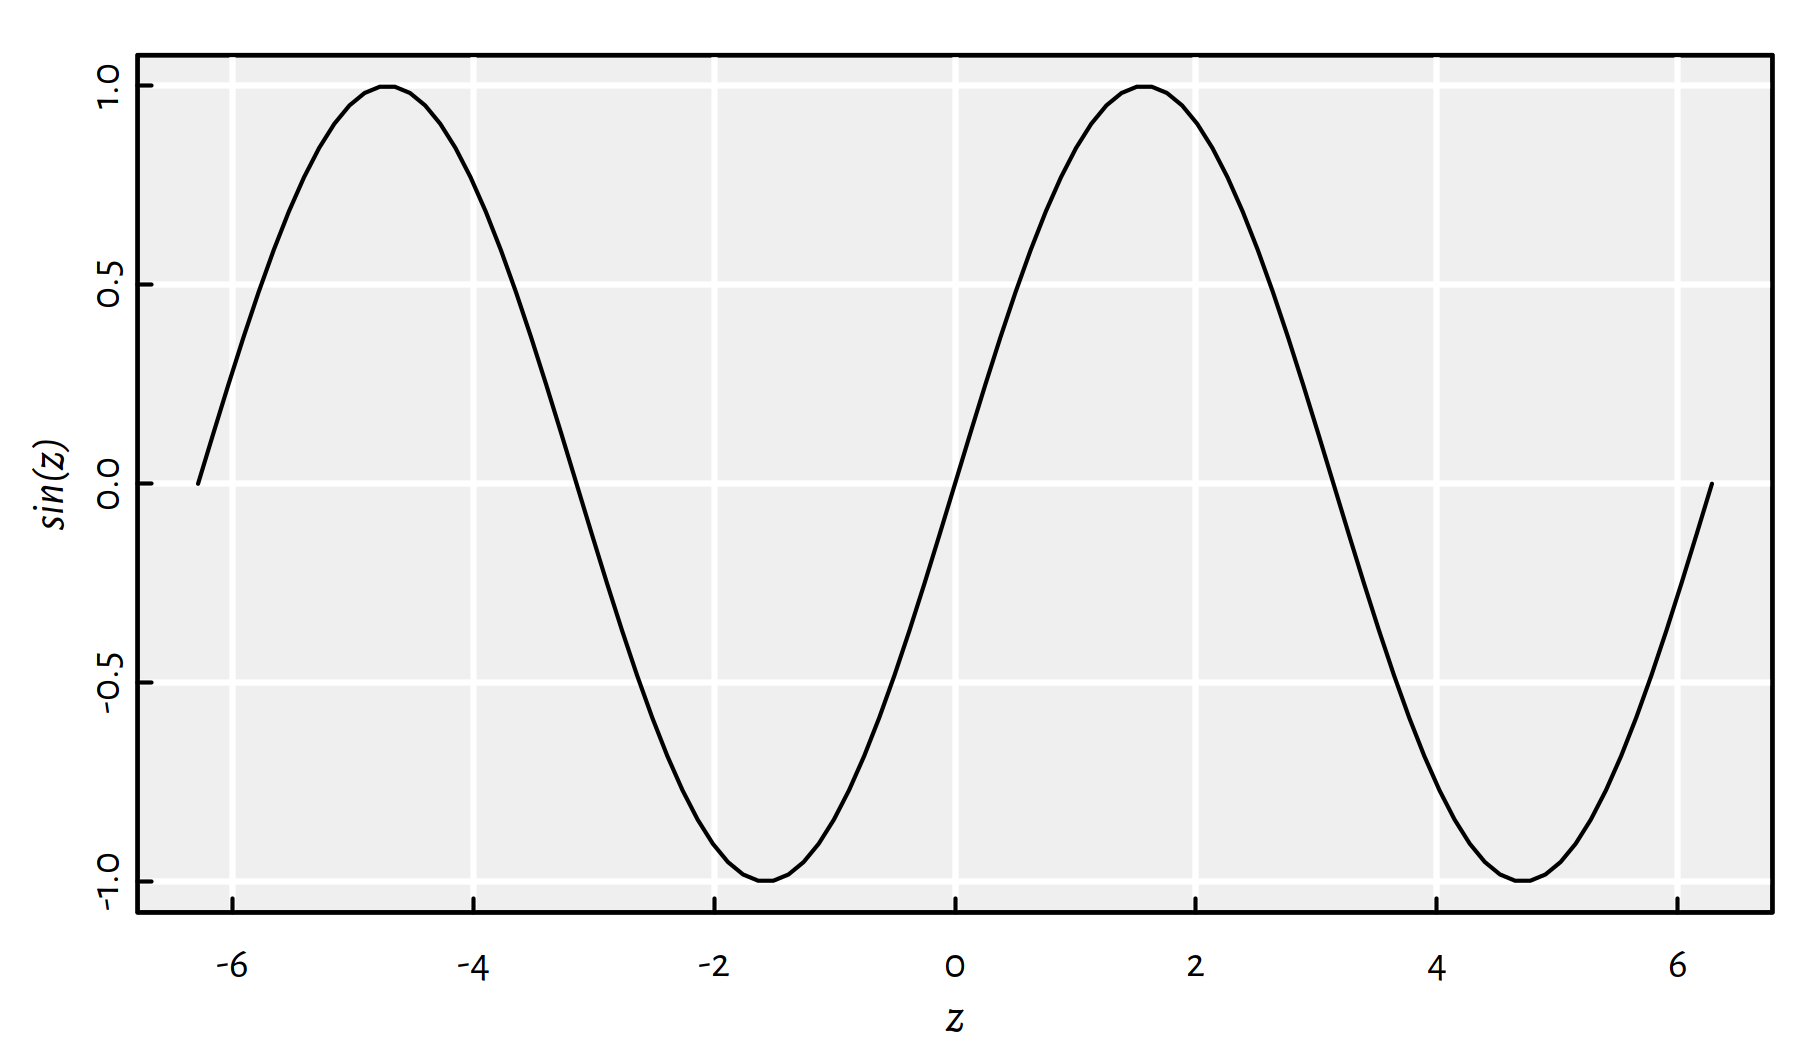
Figure E.1: Metaprogramming in action: Just take a look at the Y axis label
How did the plot() function know that we are plotting sin of z
(see Figure E.1)?
It turns out that, at any time, we not only have access to the value
of an object (such as the result of evaluating sin(z), which is
a vector of 101 reals) but also to the expression that was passed as
a function’s argument itself.
test_meta <- function(x) {
    cat("x equals to ", x, "\n") # \n == newline
    cat("x stemmed from ", deparse(substitute(x)), "\n")
}
test_meta(2+7)
## x equals to 9
## x stemmed from 2 + 7This is very powerful and yet potentially very confusing to the users, because we can write functions that don’t compute the arguments provided in a way we expect them to (i.e., following the R language specification). Each function can constitute a new micro-verse, where with its own rules – we should always refer to the documentation.
For instance, consider the subset() function:
head(iris)## Sepal.Length Sepal.Width Petal.Length Petal.Width Species
## 1 5.1 3.5 1.4 0.2 setosa
## 2 4.9 3.0 1.4 0.2 setosa
## 3 4.7 3.2 1.3 0.2 setosa
## 4 4.6 3.1 1.5 0.2 setosa
## 5 5.0 3.6 1.4 0.2 setosa
## 6 5.4 3.9 1.7 0.4 setosasubset(iris, Sepal.Length>7.5, select=-(Sepal.Width:Petal.Width))## Sepal.Length Species
## 106 7.6 virginica
## 118 7.7 virginica
## 119 7.7 virginica
## 123 7.7 virginica
## 132 7.9 virginica
## 136 7.7 virginicaNeither Sepal.Length>6 nor -(Sepal.Width:Petal.Width) make sense
as standalone R expressions! However, according to the subset() function’s
own rules, the former expression is considered as a row selector
(here, Sepal.Length refers to a particular column within the iris data frame).
The latter plays the role of a column filter (select everything but all the columns
between…).
The data.table and dplyr packages (which are very popular) rely on this language feature all the time, so we shouldn’t be surprised when we see them.
There is one more interesting language feature that is possible
thanks to metaprogramming.
Formulas are special R objects that consist of two unevaluated
R expressions separated by a tilde (~).
For example:
len ~ supp+dose## len ~ supp + doseA formula on its own has no meaning. However, many R functions accept formulas as arguments and can interpret them in various different ways.
For example, the lm() function that fits a linear regression model,
uses formulas to specify the output and input variables:
lm(Sepal.Length~Petal.Length+Sepal.Width, data=iris)##
## Call:
## lm(formula = Sepal.Length ~ Petal.Length + Sepal.Width, data = iris)
##
## Coefficients:
## (Intercept) Petal.Length Sepal.Width
## 2.249 0.472 0.596On the other hand, boxplot() (see Figure E.2)
allows for creating
separate box-and-whisker plots for each subgroup given by a combination
of factors.
boxplot(len~supp+dose, data=ToothGrowth,
    horizontal=TRUE, col="white")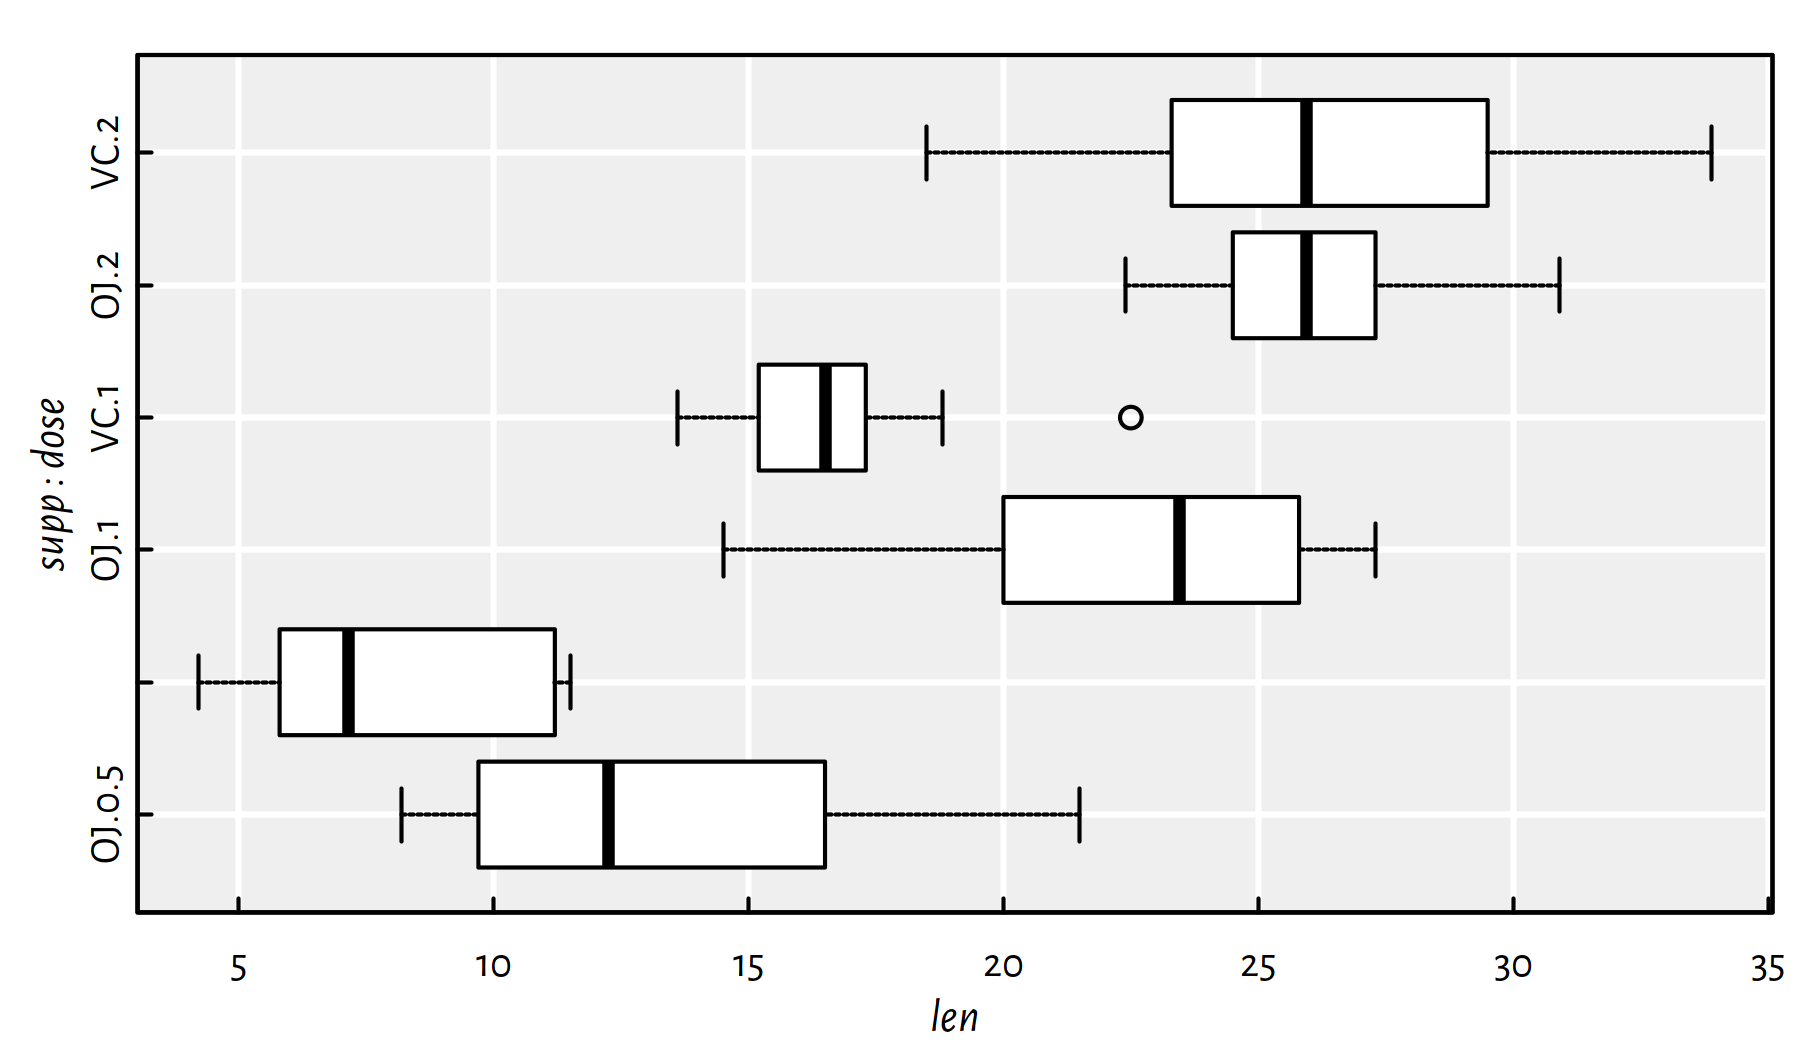
Figure E.2: Example box plot created via the formula interface
The aggregate() function supports formulas too:
aggregate(cbind(Sepal.Length, Sepal.Width)~Species, data=iris, mean)## Species Sepal.Length Sepal.Width
## 1 setosa 5.006 3.428
## 2 versicolor 5.936 2.770
## 3 virginica 6.588 2.974We should therefore make sure that we know how every function interacts
with a formula – information on that can be found in ?lm, ?boxplot,
?aggregate and so forth.
E.6 Further Reading
Recommended further reading: (Venables et al. 2021)
Other: (Peng 2019), (Wickham & Grolemund 2017)
R packages dplyr and data.table implement the most common
data frame wrangling procedures. You may find them very useful.
Moreover, they are very fast even for large data sets.
Additionally, the magrittr package provides a pipe operator, %>%,
that simplifies the writing of complex, nested function calls.
Do note that not everyone is a big fan of these, however.